Observability
SimpleW provides built-in observability through OpenTelemetry, the open standard for distributed tracing, metrics, and logs.
Telemetry in SimpleW is opt-in and lightweight by design. When enabled, the server automatically emits :
- Traces for each HTTP request lifecycle
- Metrics for request/response counts and durations
- Rich context (request, response, routing, exceptions)
This allows SimpleW to integrate seamlessly with any OpenTelemetry-compatible backend (Uptrace, Jaeger, Tempo, Datadog, etc.).
Telemetry Overview
When telemetry is enabled, SimpleW automatically :
- Starts a server span per HTTP request
- Enriches spans with HTTP, network, routing, and client metadata
- Emits metrics using OpenTelemetry
Meter - Exposes a hook to customize or override telemetry tags
Telemetry is based on :
System.Diagnostics.ActivitySystem.Diagnostics.Metrics- OpenTelemetry semantic conventions
Logging (Local Development)
Logs are extremely useful during development to understand request flow and timings.
The following example shows how to :
- Enable SimpleW telemetry
- Subscribe to all SimpleW OpenTelemetry events
- Log each HTTP request to the console using a custom ActivityProcessor
WARNING
This approach is for local debugging only. Do not use it in production.
using System;
using System.Net;
using System.Diagnostics;
using System.Diagnostics.Metrics;
using OpenTelemetry;
using OpenTelemetry.Resources;
using OpenTelemetry.Trace;
using SimpleW;

namespace Sample {
    class Program {

        private static TracerProvider? _tracerProvider;

        static async Task Main() {

            // subscribe to all SimpleW events
            openTelemetryObserver("SimpleW");

            var server = new SimpleWServer(IPAddress.Any, 2015);

            // enable telemetry
            server.EnableTelemetry();

            server.MapControllers<Controller>("/api");
            Console.WriteLine("server started at http://localhost:{server.Port}/");
            await server.RunAsync();
        }

        static void openTelemetryObserver(string source) {
            _tracerProvider = Sdk.CreateTracerProviderBuilder()
                                 .AddSource(source)
                                 .AddProcessor(new LogProcessor()) // custom log processor
                                 .SetResourceBuilder(
                                     ResourceBuilder
                                         .CreateEmpty()
                                         .AddService(serviceName: "Sample", serviceVersion: "0.1")
                                 ).Build();
        }

        // custom log processor for opentelemetry
        class LogProcessor : BaseProcessor<Activity> {
            // write log to console
            public override void OnEnd(Activity activity) {
                // WARNING : use for local debug only not production
                Console.WriteLine(
                    $"{activity.GetTagItem("http.request.method")} " +
                    $"\"{activity.GetTagItem("url.path")}\" " +
                    $"{activity.GetTagItem("http.response.status_code")} " +
                    $"{(int)activity.Duration.TotalMilliseconds}ms " +
                    $"session-{activity.GetTagItem("session_id")} " +
                    $"{activity.GetTagItem("client.address")} " +
                    $"\"{activity.GetTagItem("user_agent.original")}\""
                );
            }
        }

    }

    public class SomeController : Controller {
        [Route("GET", "/test")]
        public object SomePublicMethod() {
            return new {
                message = "Hello World !"
            };
        }
    }

}The above example shows how to :
EnableTelemetry- subscribe to all SimpleW
EventwithopenTelemetryObserver() - log each request to console with
LogProcessor(do not use for production).
Traces (Production)
For production, logs alone aren't enougth - we need a full trace for every Event. The most reliable approach is to leverage battle-tested solutions for collecting and managing telemetry data.
The team behind Uptrace has built an impressive open-source, self-hosted observability platform. They offer a helper extension for the .NET OpenTelemetry exporter as a NuGet package, making it effortless to integrate end-to-end tracing into your .NET services.
So add the official OpenTelemetry package
$ dotnet add package OpenTelemetry.Exporter.OpenTelemetryProtocolAnd see the following example, especially the openTelemetryObserver()
using System;
using System.Net;
using System.Diagnostics;
using OpenTelemetry;
using OpenTelemetry.Exporter;
using OpenTelemetry.Metrics;
using OpenTelemetry.Resources;
using OpenTelemetry.Trace;
using SimpleW;

namespace Sample {
    class Program {

        private static TracerProvider? _tracerProvider;
        private static MeterProvider? _meterProvider;

        static async Task Main() {

            // subscribe to all SimpleW events
            openTelemetryObserver("SimpleW");

            var server = new SimpleWServer(IPAddress.Any, 2015);

            // enable telemetry
            server.EnableTelemetry();

            server.MapControllers<Controller>("/api");
            Console.WriteLine("server started at http://localhost:{server.Port}/");
            await server.RunAsync();
        }

        static void openTelemetryObserver(string source) {
            _tracerProvider = Sdk.CreateTracerProviderBuilder()
                                 .AddSource(source)
                                 //.SetSampler(new ParentBasedSampler(new TraceIdRatioBasedSampler(10.0)))
                                 .AddOtlpExporter((options) => {
                                     options.Endpoint = new Uri("https://api.uptrace.dev/v1/traces");
                                     options.Headers = "uptrace-dsn=APIKEY";
                                     options.Protocol = OtlpExportProtocol.HttpProtobuf;
                                 })
                                 .SetResourceBuilder(ResourceBuilder.CreateEmpty().AddService(serviceName: "Example", serviceVersion: "0.1"))
                                 .Build();

            _meterProvider = Sdk.CreateMeterProviderBuilder()
                                .AddMeter(source)
                                .SetResourceBuilder(ResourceBuilder.CreateEmpty().AddService(serviceName: "Example", serviceVersion: "0.1"))
                                .AddOtlpExporter((exporterOptions, metricReaderOptions) => {
                                    exporterOptions.Endpoint = new Uri("https://api.uptrace.dev/v1/metrics");
                                    exporterOptions.Headers = "uptrace-dsn=APIKEY";
                                    exporterOptions.Protocol = OtlpExportProtocol.HttpProtobuf;
                                    metricReaderOptions.TemporalityPreference = MetricReaderTemporalityPreference.Delta;
                                })
                                .Build();
        }

    }

    public class SomeController : Controller {
        [Route("GET", "/test")]
        public object SomePublicMethod() {
            return new {
                message = "Hello World !"
            };
        }
    }

}That’s it. Every HTTP request handled by SimpleW is now fully traced.
NOTE
Use OtlpExportProtocol.HttpProtobuf with .NET OpenTelemetry Exporter because the Grpc version is buggy.
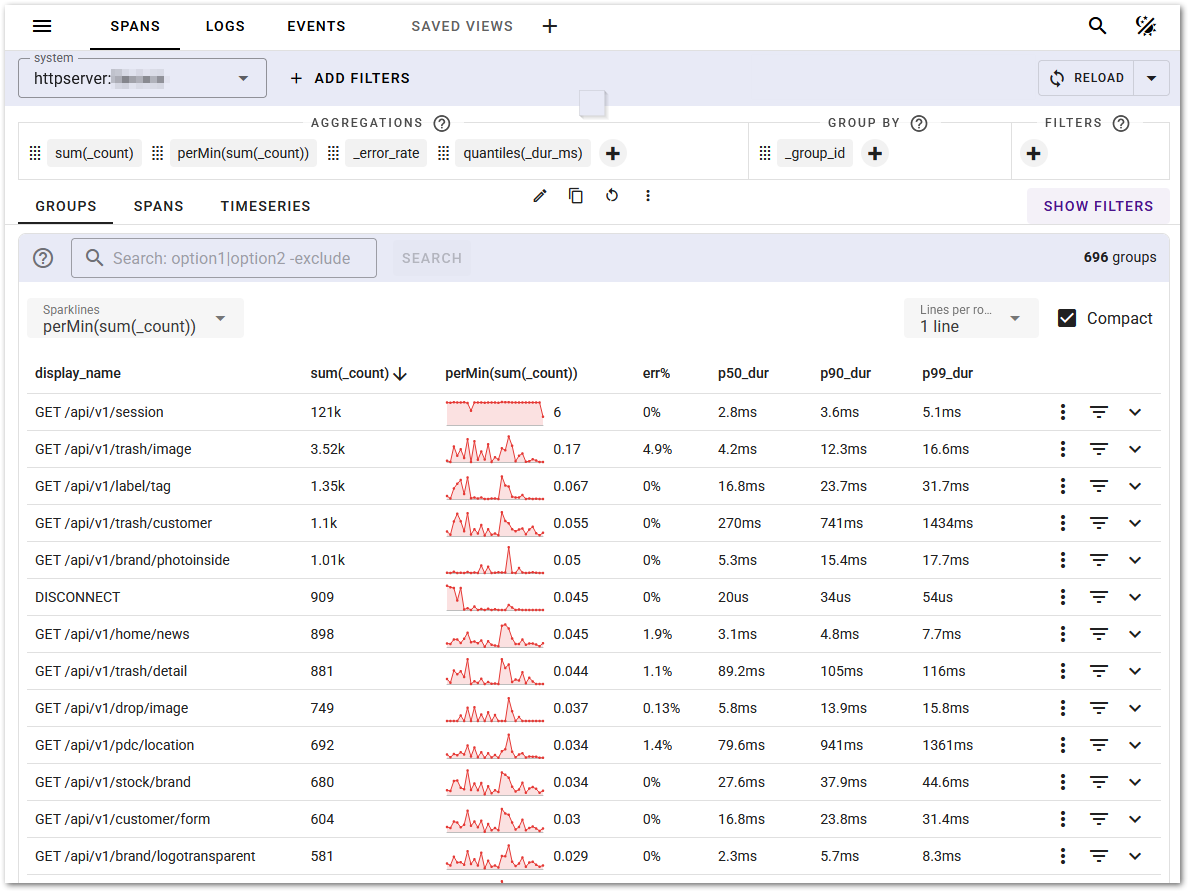
A screenshot of Uptrace Traces & Logs
Metrics
When telemetry is enabled, SimpleW emits standard HTTP server metrics using OpenTelemetry Meter, including :
- Request count
- Response count
- Request duration
- Response duration
These metrics can be scraped or collected by any OpenTelemetry-compatible metrics backend (Prometheus, Uptrace, etc.).
Telemetry Customization
When generating traces and metrics, SimpleW collects metadata from the request and connection. In some environments (behind a reverse proxy), you may want to override or enrich telemetry tags.
You can do this using SimpleWServer.ConfigureTelemetry()
Example : Trusting Reverse Proxy Headers
// configure telemetry
server.ConfigureTelemetry(options => {
    options.IncludeStackTrace = true;
    options.EnrichWithHttpSession = (activity, session) => {
        // override client.address with the X-Real-IP header (set by a trusted reverse proxy)
        if (session.Request.Headers.TryGetValue("X-Real-IP", out string? xRealIp) {
            activity.SetTag("client.address", xRealIp);
        }
        // override host with the X-Forwarded-Host header (set by a trusted reverse proxy)
        if (session.Request.Headers.TryGetValue("X-Forwarded-Host", out string? host) {
            activity.SetTag("url.host", host);
        }
    };
});This hook runs after the response is generated and allows full access to :
- The active
Activity - The complete
HttpSession
NOTE
As header can be forged on client side, you should only accept X-Headers if the underlying reverse proxy is under control and configured with a proper header policy.